La matematica dietro il monitoraggio delle calorie
Ogni tracker di calorie fa i conti per te. La maggior parte non ti mostra le equazioni. Qui le trovi, con esempi svolti, in ordine, ciascuno costruito sul precedente.
Questo post copre cinque livelli di calcolo: come si stima il tuo metabolismo di base, come quella stima diventa un obiettivo energetico giornaliero, come l'app impara il tuo dispendio reale dai dati veri, come le voci alimentari si scalano quando mangi una porzione parziale e come un deficit calorico si traduce in perdita di grasso e tessuto magro. Ogni numero è tracciabile a un'equazione. Ogni equazione è tracciabile a una fonte citata.

Livello 1: stima del BMR
Il tuo Basal Metabolic Rate è l'energia che il tuo corpo consuma a riposo completo: sdraiato, immobile, sveglio, in una stanza a temperatura neutra. Rappresenta circa il 60-70% del dispendio totale giornaliero.
La formula più validata è Mifflin-St Jeor (1990):
BMR (male)   = 10 x weight(kg) + 6.25 x height(cm) - 5 x age + 5
BMR (female) = 10 x weight(kg) + 6.25 x height(cm) - 5 x age - 161
Ogni termine descrive una relazione fisiologica. I corpi più pesanti consumano più energia. Il termine del peso domina. I corpi più alti hanno più superficie e più tessuto metabolicamente attivo. Il metabolismo diminuisce con l'età. L'offset per il sesso tiene conto delle differenze nella composizione corporea media.
Esempio svolto. Un uomo di 30 anni, 82 kg, 178 cm:
10 x 82   = 820
6.25 x 178 = 1,112.5
5 x 30    = 150
sex offset = +5

BMR = 820 + 1,112.5 - 150 + 5 = 1,787.5 kcal
Questa è una media di popolazione. Mifflin-St Jeor è stata ricavata da misurazioni di calorimetria indiretta su 498 soggetti. Per un individuo, l'errore standard è circa ±200 kcal, il che significa che due persone con statistiche identiche possono avere BMR diversi di 400 kcal. La formula ti dà il centro della curva a campana, non la tua misurazione personale.
Fonte: Mifflin, M.D. et al. "A new predictive equation for resting energy expenditure in healthy individuals." American Journal of Clinical Nutrition, 1990.
Livello 2: da BMR a TDEE
Il BMR è il pavimento. Il Total Daily Energy Expenditure (TDEE) aggiunge tutto il resto: camminare, lavorare, allenarsi, digerire il cibo, agitarsi. L'approccio tradizionale moltiplica il BMR per un fattore di attività:
| Livello di attività | Moltiplicatore | Cosa significa davvero |
|---|---|---|
| Sedentario | 1.200 | Lavoro alla scrivania, poca camminata |
| Leggermente attivo | 1.375 | ~8.000 passi/giorno o esercizio leggero 2x/settimana |
| Moderatamente attivo | 1.550 | ~10.000 passi + allenamento di resistenza 3x/settimana |
| Attivo | 1.725 | Lavoro fisico o allenamento 5x/settimana |
| Molto attivo | 1.900 | Allenamento intenso ogni giorno + stile di vita attivo |
Per il nostro esempio svolto (BMR = 1,788 kcal, leggermente attivo):
TDEE = 1,788 x 1.375 = 2,458 kcal
Il problema è evidente appena lo vedi: il salto tra i livelli è 0.175, che si traduce in ~310 kcal per un BMR di 1,788. È una banana intera più un cucchiaio di burro d'arachidi. Se scegli il livello di attività sbagliato, e la maggior parte delle persone lo fa, la tua stima del TDEE è fuori di centinaia di calorie prima ancora di registrare un pasto.
Peggio ancora, i moltiplicatori non riescono a catturare il NEAT (Non-Exercise Activity Thermogenesis): agitarsi, postura, andare avanti e indietro, faccende domestiche. Il solo NEAT varia di oltre 700 kcal/giorno tra individui con statistiche e abitudini di allenamento identiche.
Calcolatore BMR / TDEE
Equazione di Mifflin-St Jeor
Livello 3: TDEE adattivo
Le formule statiche stimano quanto probabilmente consuma qualcuno come te. Il TDEE adattivo calcola quanto hai consumato tu davvero, risalendo a ritroso da ciò che è successo al tuo corpo.
L'idea chiave: se sai quante calorie hai mangiato e come il tuo peso è cambiato nel tempo, puoi risolvere il dispendio.
L'algoritmo
Dato un intervallo di 28 giorni di dati:
Passo 1. Fai la media dell'introito calorico solo nei giorni tracciati. I giorni senza log alimentari sono esclusi del tutto (non contano come zero).
Passo 2. Smussa le rilevazioni giornaliere del peso con una Media Mobile Esponenziale a 7 giorni per filtrare acqua, glicogeno e rumore del sodio. Poi applica una regressione lineare ai minimi quadrati alla serie smussata. La pendenza è il tuo vero trend di peso in kg/giorno.
Passo 3. Converti la pendenza del peso in calorie:
caloric impact = daily weight slope x 7,700 kcal/kg
Il valore 7,700 kcal/kg è l'approssimazione standard della densità energetica del tessuto corporeo (una miscela ponderata di grasso a ~7,700 e massa magra a ~1,800).
Passo 4. Stima il TDEE:
TDEE = average daily intake - caloric impact
Se stai perdendo peso, l'impatto calorico è negativo, quindi il TDEE risulta più alto dell'introito. Se stai aumentando, risulta più basso. Se il peso è stabile, TDEE e introito coincidono.
Passo 5. Limita l'aggiustamento giornaliero a ±100 kcal rispetto alla stima precedente. Questo evita che dati rumorosi producano oscillazioni estreme.
Esempio svolto
Ecco un dataset reale di 28 giorni per qualcuno che sta perdendo circa 0.3 kg/settimana:
| Giorno | Peso (kg) | EMA (kg) | Calorie | Tracciato? |
|---|---|---|---|---|
| 1 | 82.3 | 82.30 | 2,180 | Sì |
| 4 | 82.5 | 82.35 | 2,210 | Sì |
| 7 | 81.8 | 82.15 | 2,050 | Sì |
| 10 | 82.0 | 81.96 | -- | No |
| 14 | 81.7 | 81.72 | 2,100 | Sì |
| 21 | 80.9 | 81.12 | 2,180 | Sì |
| 24 | 81.0 | 80.93 | 2,120 | Sì |
| 28 | 80.7 | 80.72 | 2,050 | Sì |

Il calcolo:
Average intake (tracked days): 2,150 kcal/day
EMA weight slope (regression): -0.042 kg/day
Caloric impact: -0.042 x 7,700 = -323 kcal/day
Estimated TDEE: 2,150 - (-323) = 2,473 kcal
Questo numero riflette il tuo metabolismo reale: NEAT, adattamento, genetica, tutto. Nessuna ipotesi sul tuo livello di attività.
Perché 28 giorni
Il peso giornaliero fluttua di ±1 kg per ritenzione idrica, riserve di glicogeno, massa alimentare in transito e introito di sodio. Per qualcuno che perde 0.5 kg/settimana, il segnale atteso su 14 giorni è ~1 kg, appena sopra il rumore di fondo. Una finestra di 28 giorni cattura ~2 kg di segnale contro lo stesso rumore, raddoppiando circa il rapporto segnale-rumore.
Per maggiori dettagli sulla lunghezza della finestra, sullo smoothing EMA e sul comportamento di convergenza, vedi Perché il tuo calcolatore di TDEE è probabilmente sbagliato.
Livello 4: scaling dei macro
Quando registri un alimento, quasi mai stai mangiando esattamente la porzione presente nel database. Lo scaling dei macro è l'aritmetica che adatta tutto in modo proporzionale:
scaling factor = consumed amount / serving size
Ogni macro viene moltiplicato per lo stesso fattore. È uno scaling lineare.
Esempio svolto. Una voce del database per l'avena: porzione da 100g, 389 kcal, 13.2g di proteine, 66.3g di carboidrati, 6.9g di grassi. Ne hai mangiati 45g.
factor = 45 / 100 = 0.45

calories: 389 x 0.45 = 175.1 kcal
protein:  13.2 x 0.45 = 5.9g
carbs:    66.3 x 0.45 = 29.8g
fat:      6.9 x 0.45 = 3.1g
È semplice, ma c'è una sottigliezza che confonde le persone: i macro non sempre sommano alle calorie.
I fattori di Atwater (4 kcal/g proteine, 4 kcal/g carboidrati, 9 kcal/g grassi) sono approssimazioni. I valori reali variano da alimento a alimento. Le fibre contribuiscono per circa 2 kcal/g, l'alcol per 7 kcal/g, e nessuno dei due è un macro standard. Quando un database alimentare riporta sia le calorie totali sia i macro, spesso provengono da misurazioni di laboratorio indipendenti. Dopo aver arrotondato ogni macro a una cifra decimale e applicato i fattori di Atwater, la somma può differire dalle calorie indicate di 5-15 kcal per porzione. Su un'intera giornata di logging, l'effetto si accumula.
Non è un bug. È l'imprecisione intrinseca del sistema di Atwater. Il totale calorico è più accurato della somma delle calorie derivate dai macro, perché il totale viene misurato direttamente tramite calorimetria a bomba o analisi prossima.
Livello 5: matematica del deficit e composizione corporea
L'equazione dell'equilibrio energetico:
weight change = (intake - expenditure) / energy density of tissue
Un deficit di 500 kcal/giorno dovrebbe produrre 0.45 kg/settimana di perdita di peso se usi il classico 7,700 kcal/kg. Ma quel numero presume che tutto il peso perso sia grasso. Non è così.
Il modello Forbes/Hall prevede quale frazione della perdita di peso sia grasso rispetto al tessuto magro, in base a quanta massa grassa porti:
P-ratio = fat mass / (fat mass + 10.4)
Il P-ratio è la frazione del cambiamento di peso che proviene dal grasso. La costante 10.4 è derivata empiricamente da studi sulla composizione corporea (Forbes 1987, raffinato da Hall 2007).
Più alta è la percentuale di grasso corporeo, più alto è il P-ratio, quindi maggiore è la quota di perdita che viene dal grasso. Più bassa è la percentuale di grasso corporeo, più tessuto magro viene sacrificato. Ecco perché deficit aggressivi con percentuali di grasso basse sono controproducenti: la matematica gioca contro di te.
Esempio svolto. Una persona di 80 kg al 22% di grasso corporeo, con un deficit di 500 kcal:
Fat mass:       80 x 0.22 = 17.6 kg
P-ratio:        17.6 / (17.6 + 10.4) = 0.629
Mixed density:  0.629 x 7,700 + 0.371 x 1,800 = 5,510 kcal/kg
Daily loss:     500 / 5,510 = 0.091 kg/day
Daily fat loss: 0.091 x 0.629 = 0.057 kg/day
Weekly total:   0.64 kg
  of which fat: 0.40 kg (63%)
  of which lean: 0.24 kg (37%)

Non 0.45 kg/settimana di grasso puro. Il numero reale dipende da dove parti.
Al 35% di grasso corporeo, il P-ratio è 0.77: quasi l'80% della perdita è grasso. Al 12% di grasso corporeo, scende a 0.54: quasi metà della perdita è tessuto magro. Stesso deficit, corpi diversi, risultati diversi.
Calcolatore P-Ratio
Composizione corporea
Ripartizione energetica
Perdita prevista
Fonti: Forbes, G.B. "Lean body mass-body fat interrelationships in humans." Nutrition Reviews, 1987. Hall, K.D. "Body fat and fat-free mass inter-relationships." British Journal of Nutrition, 2007.
Dove lo vedi nell'app
Queste sono le equazioni che funzionano dentro Onyx Tenet. Ecco come appaiono nella pratica.
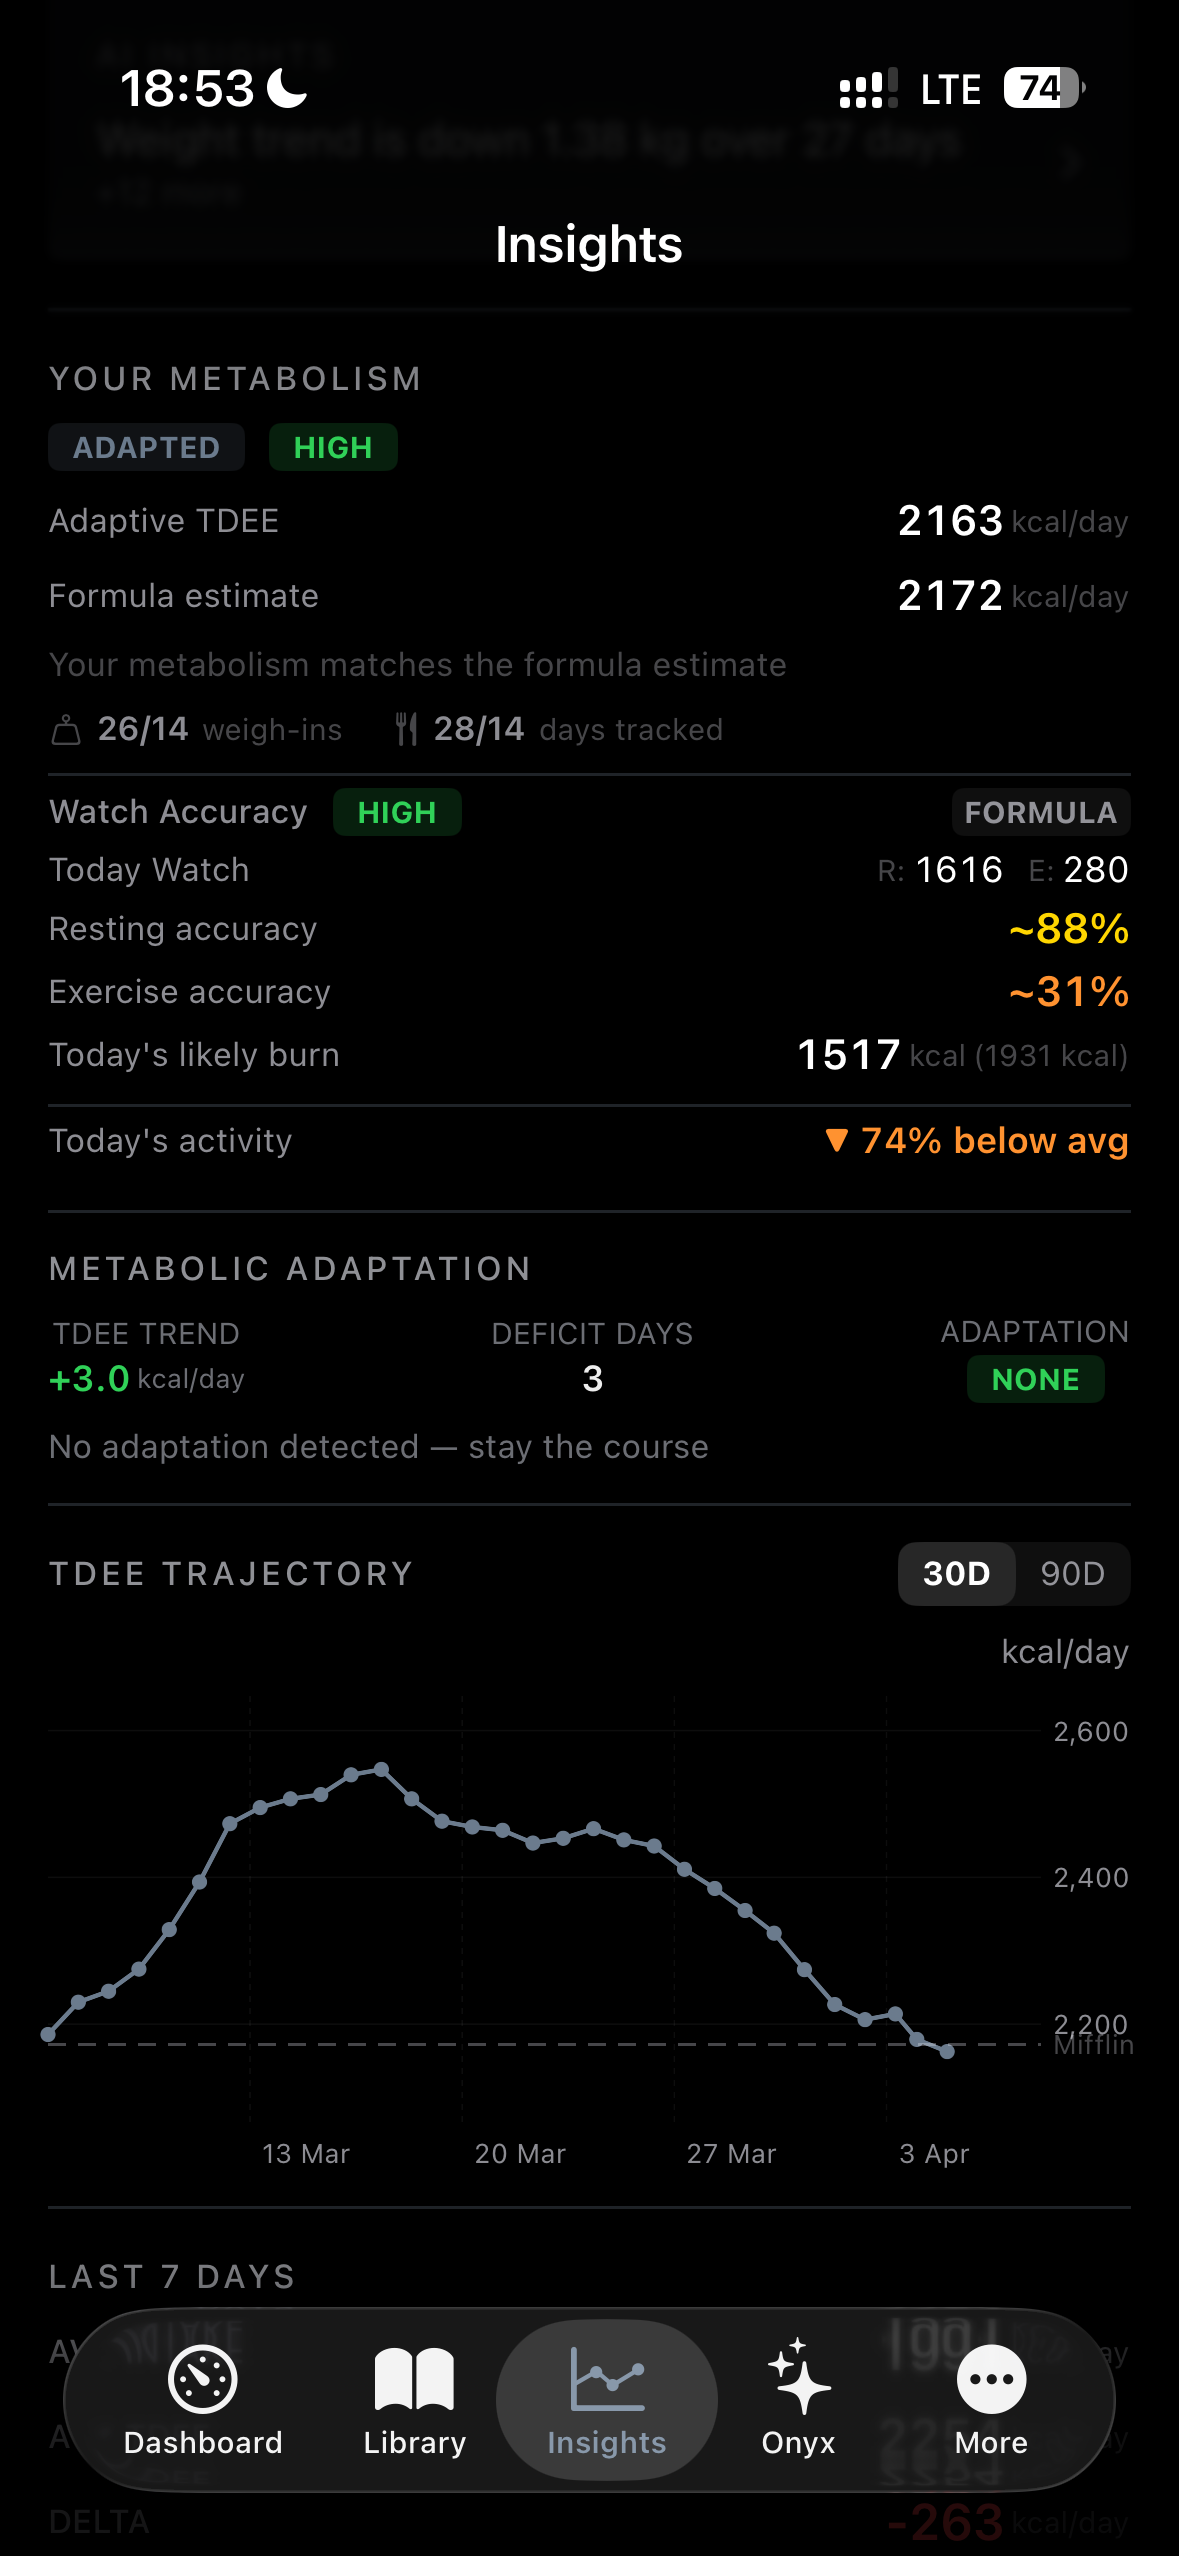
La card TDEE mostra sia la stima della formula sia il valore adattato, con un badge di confidenza e le statistiche di copertura dei dati. Il grafico TDEE Trajectory mostra come la stima è evoluta nel tempo. In questo esempio, il TDEE adattivo (2,163 kcal) corrisponde da vicino alla stima della formula (2,172 kcal), confermato da 26 pesate e 28 giorni tracciati.
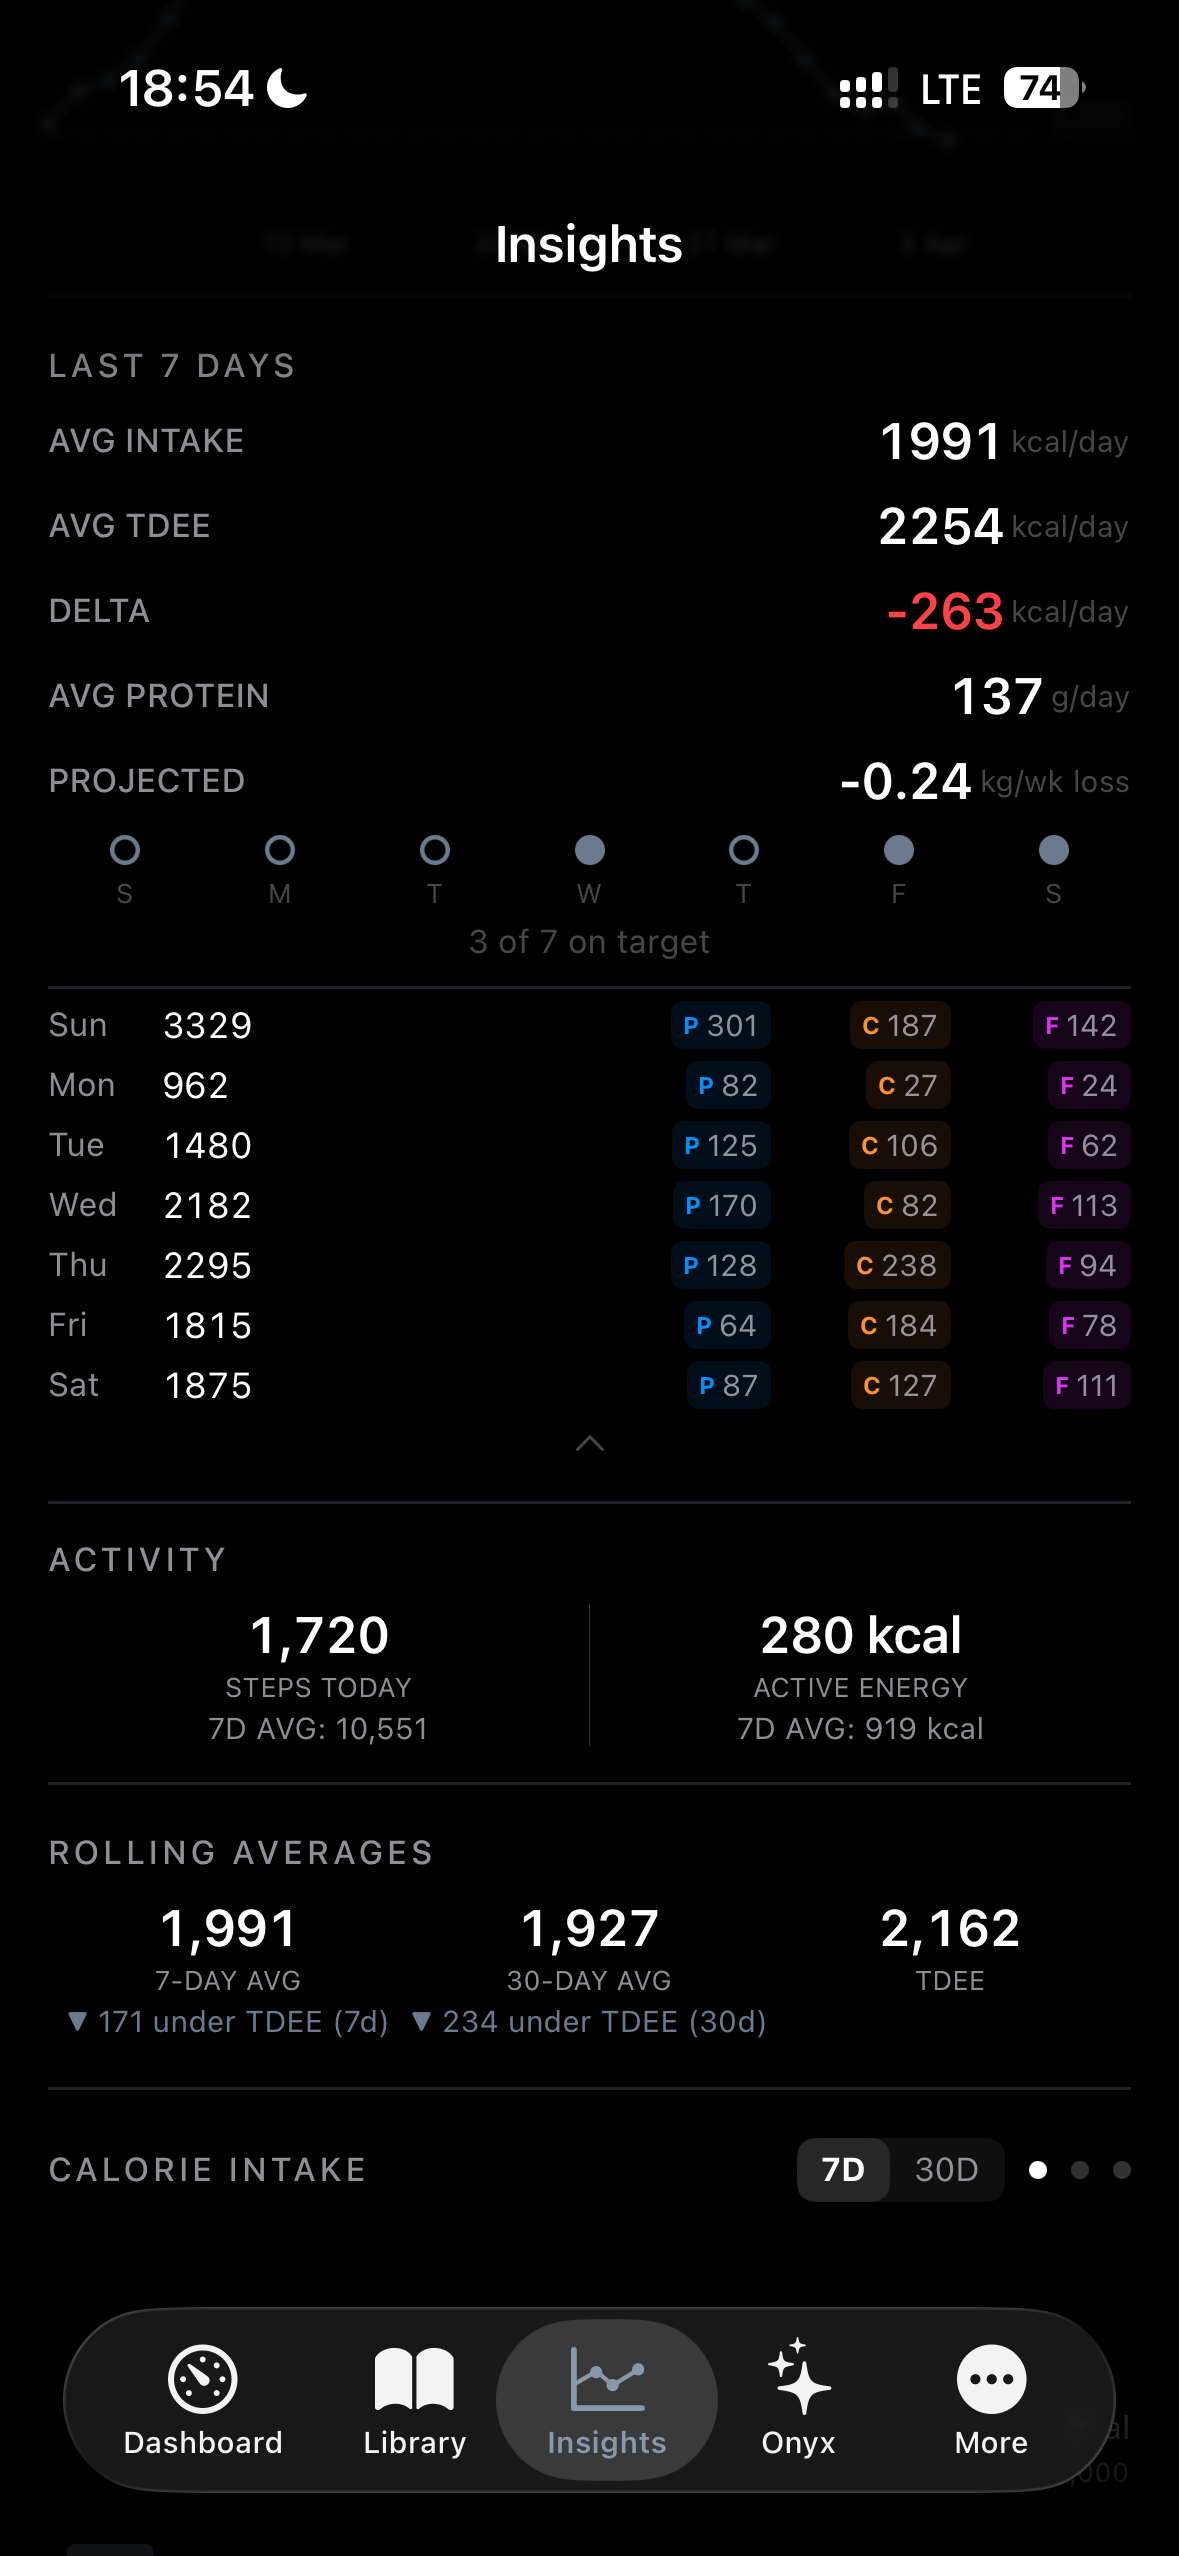
Il riepilogo settimanale applica l'equazione dell'equilibrio energetico del Livello 5. L'introito medio (1,991 kcal) meno il TDEE medio (2,254 kcal) dà un deficit giornaliero di 263 kcal, che proietta -0.24 kg/settimana di variazione di peso. I macro di ogni giorno sono visibili nel dettaglio qui sotto.
Ogni numero risale a una delle equazioni sopra. Nessuna scatola nera.
Il TDEE adattivo in Onyx Tenet è gratis. Si attiva automaticamente dopo circa 4 settimane di logging e pesate. Nessun abbonamento richiesto.